Henley Whalers ![]()
![]()
![]() River Conditions at Henley
River Conditions at Henley

Henley Whalers | |
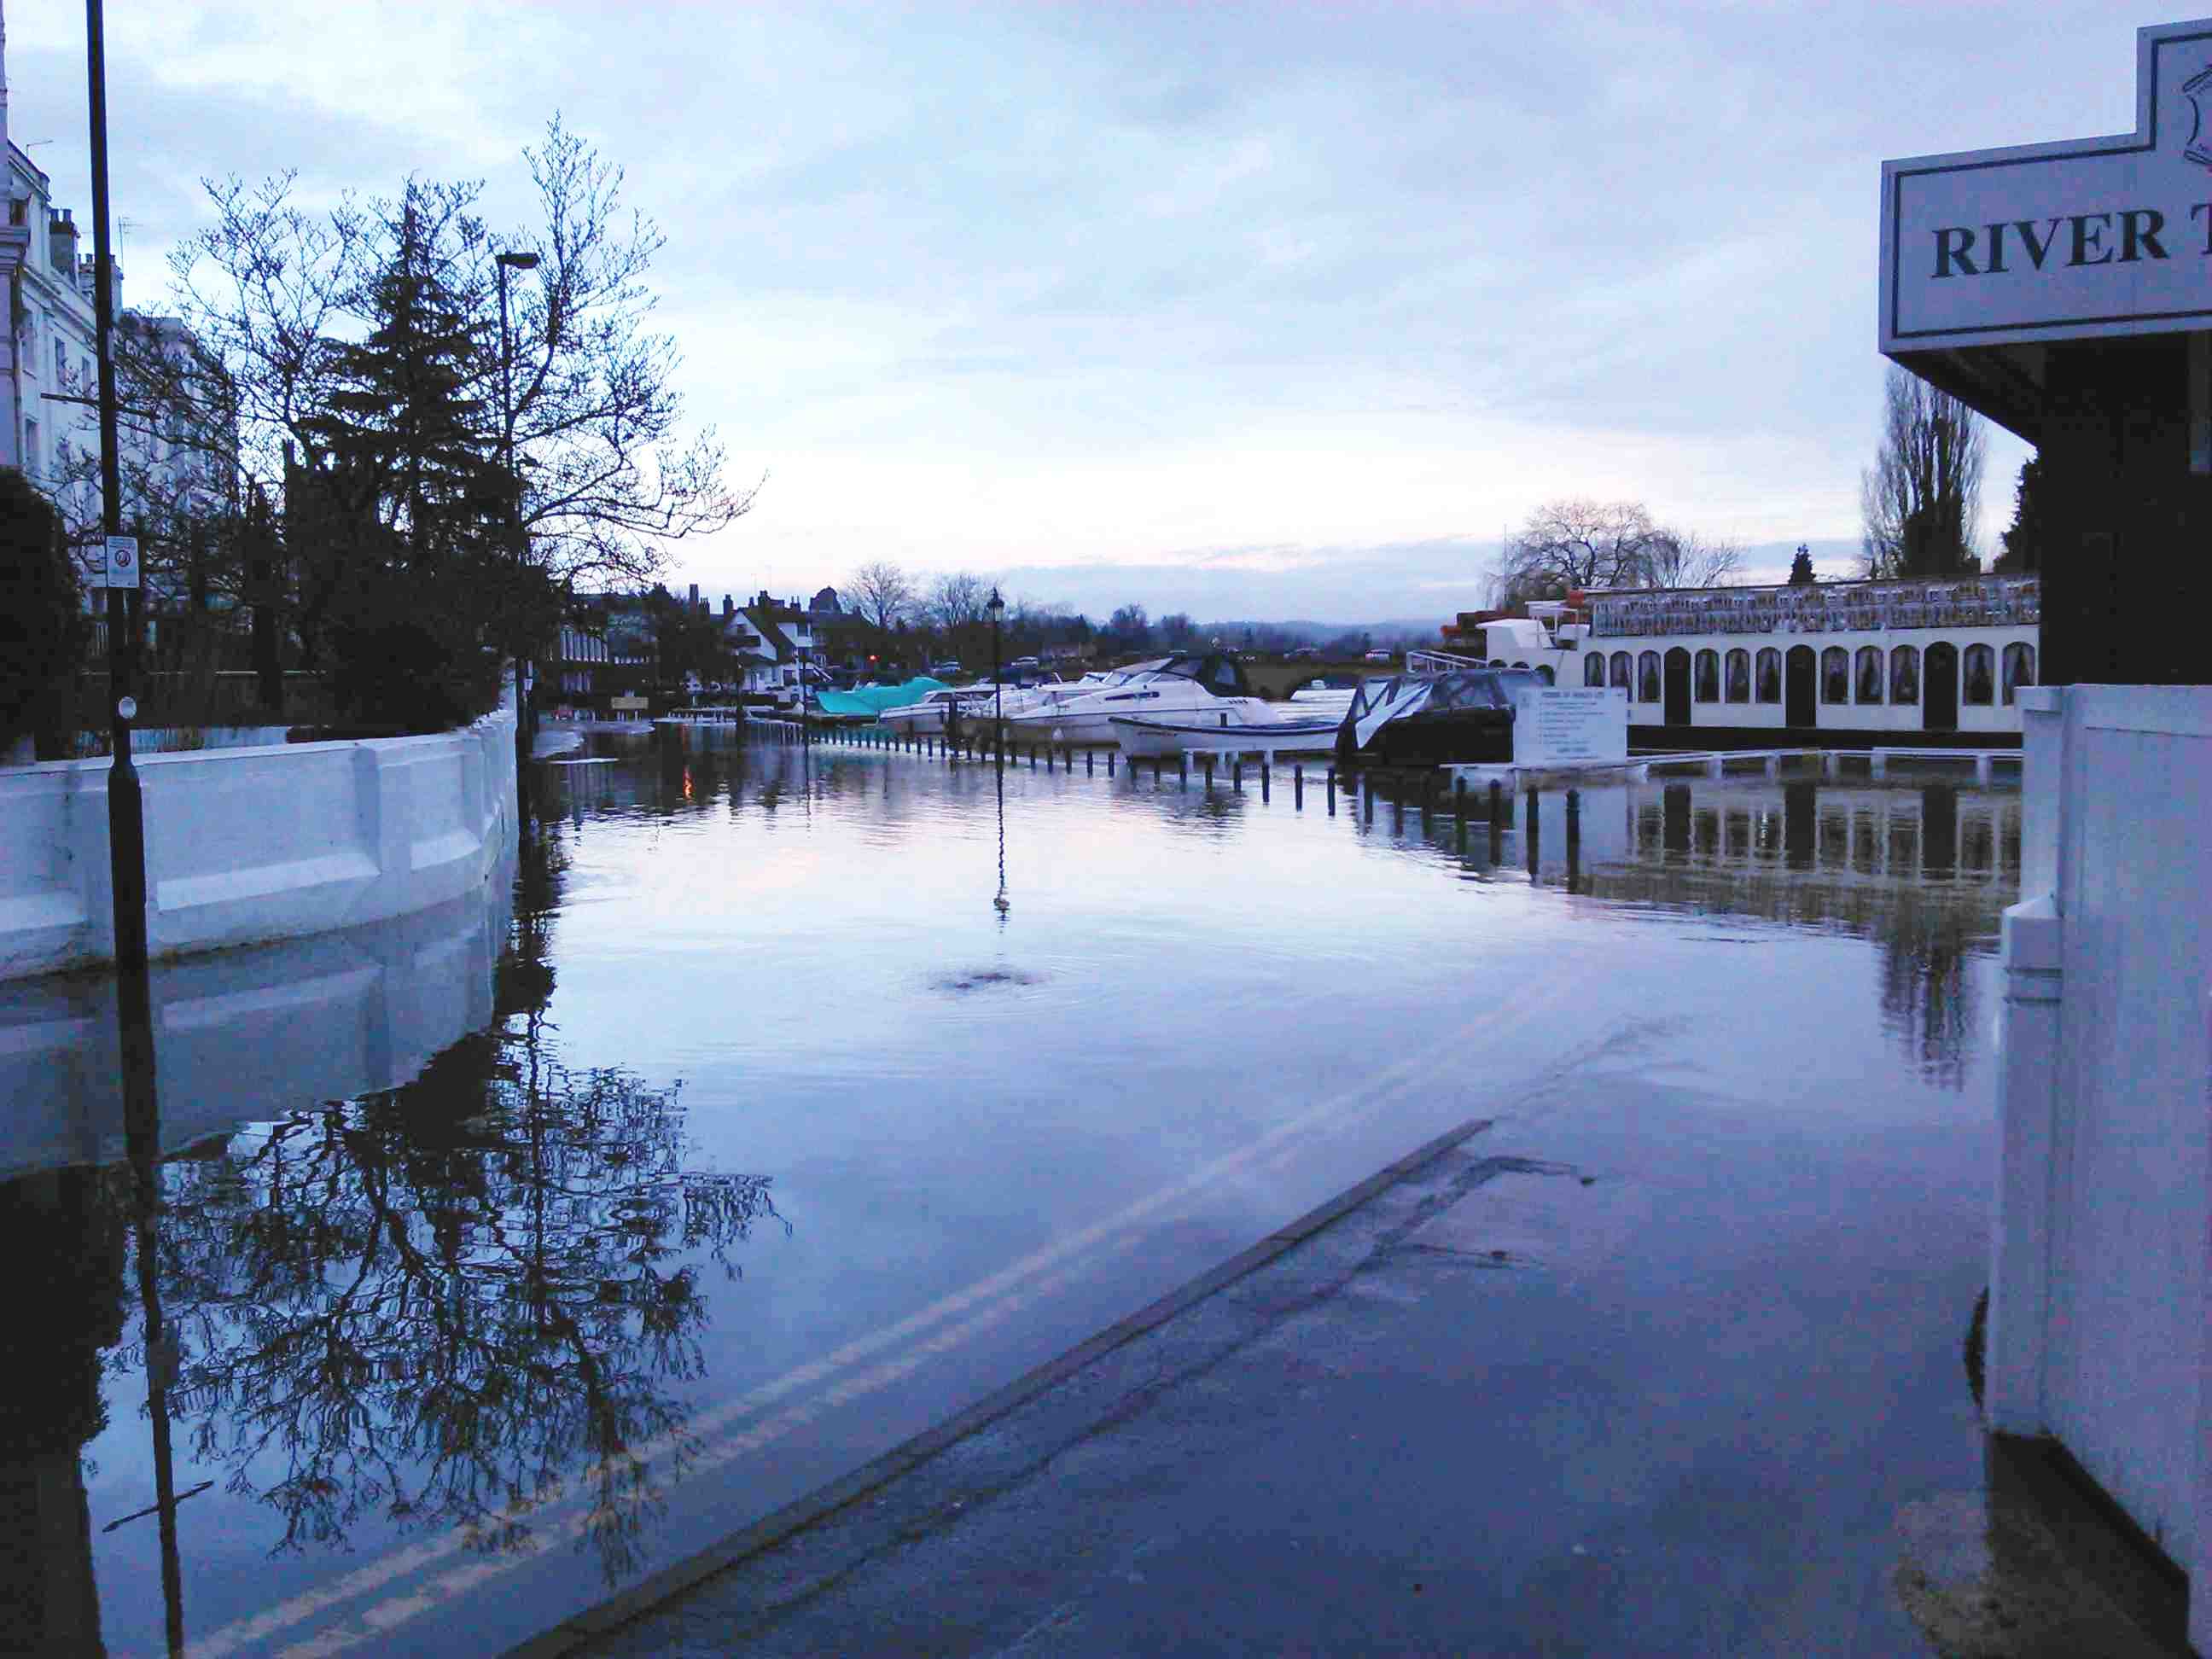
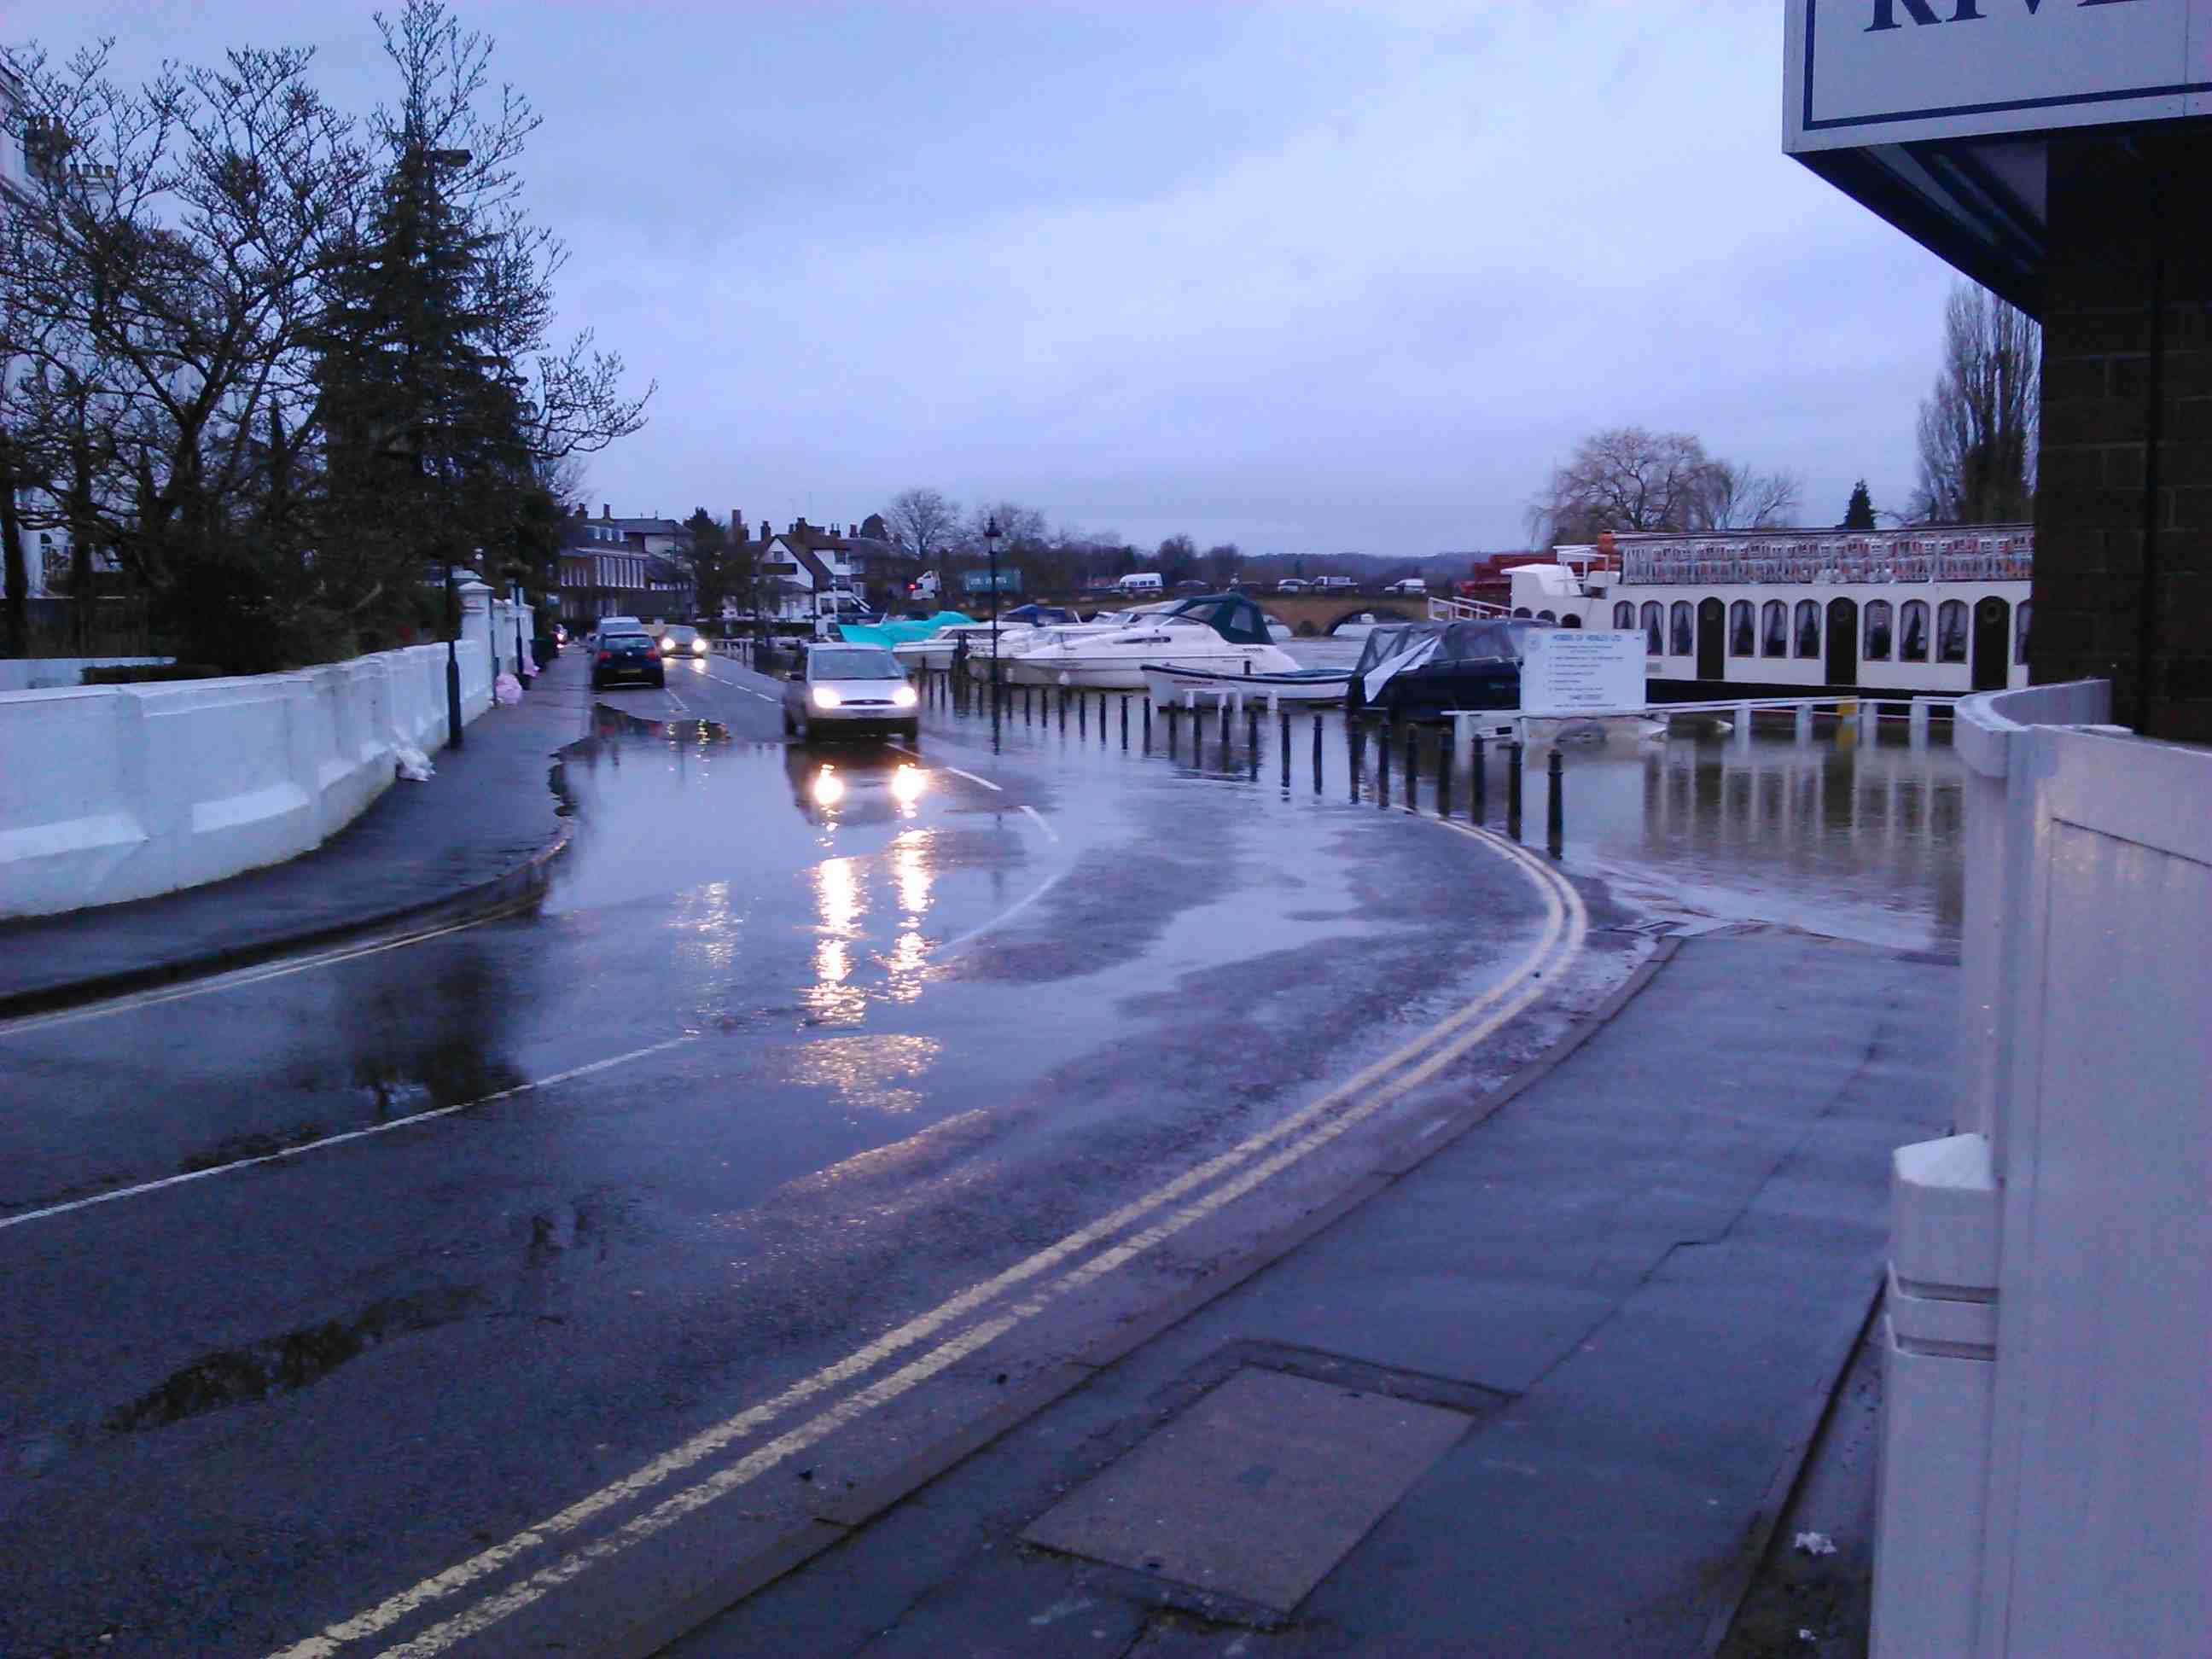
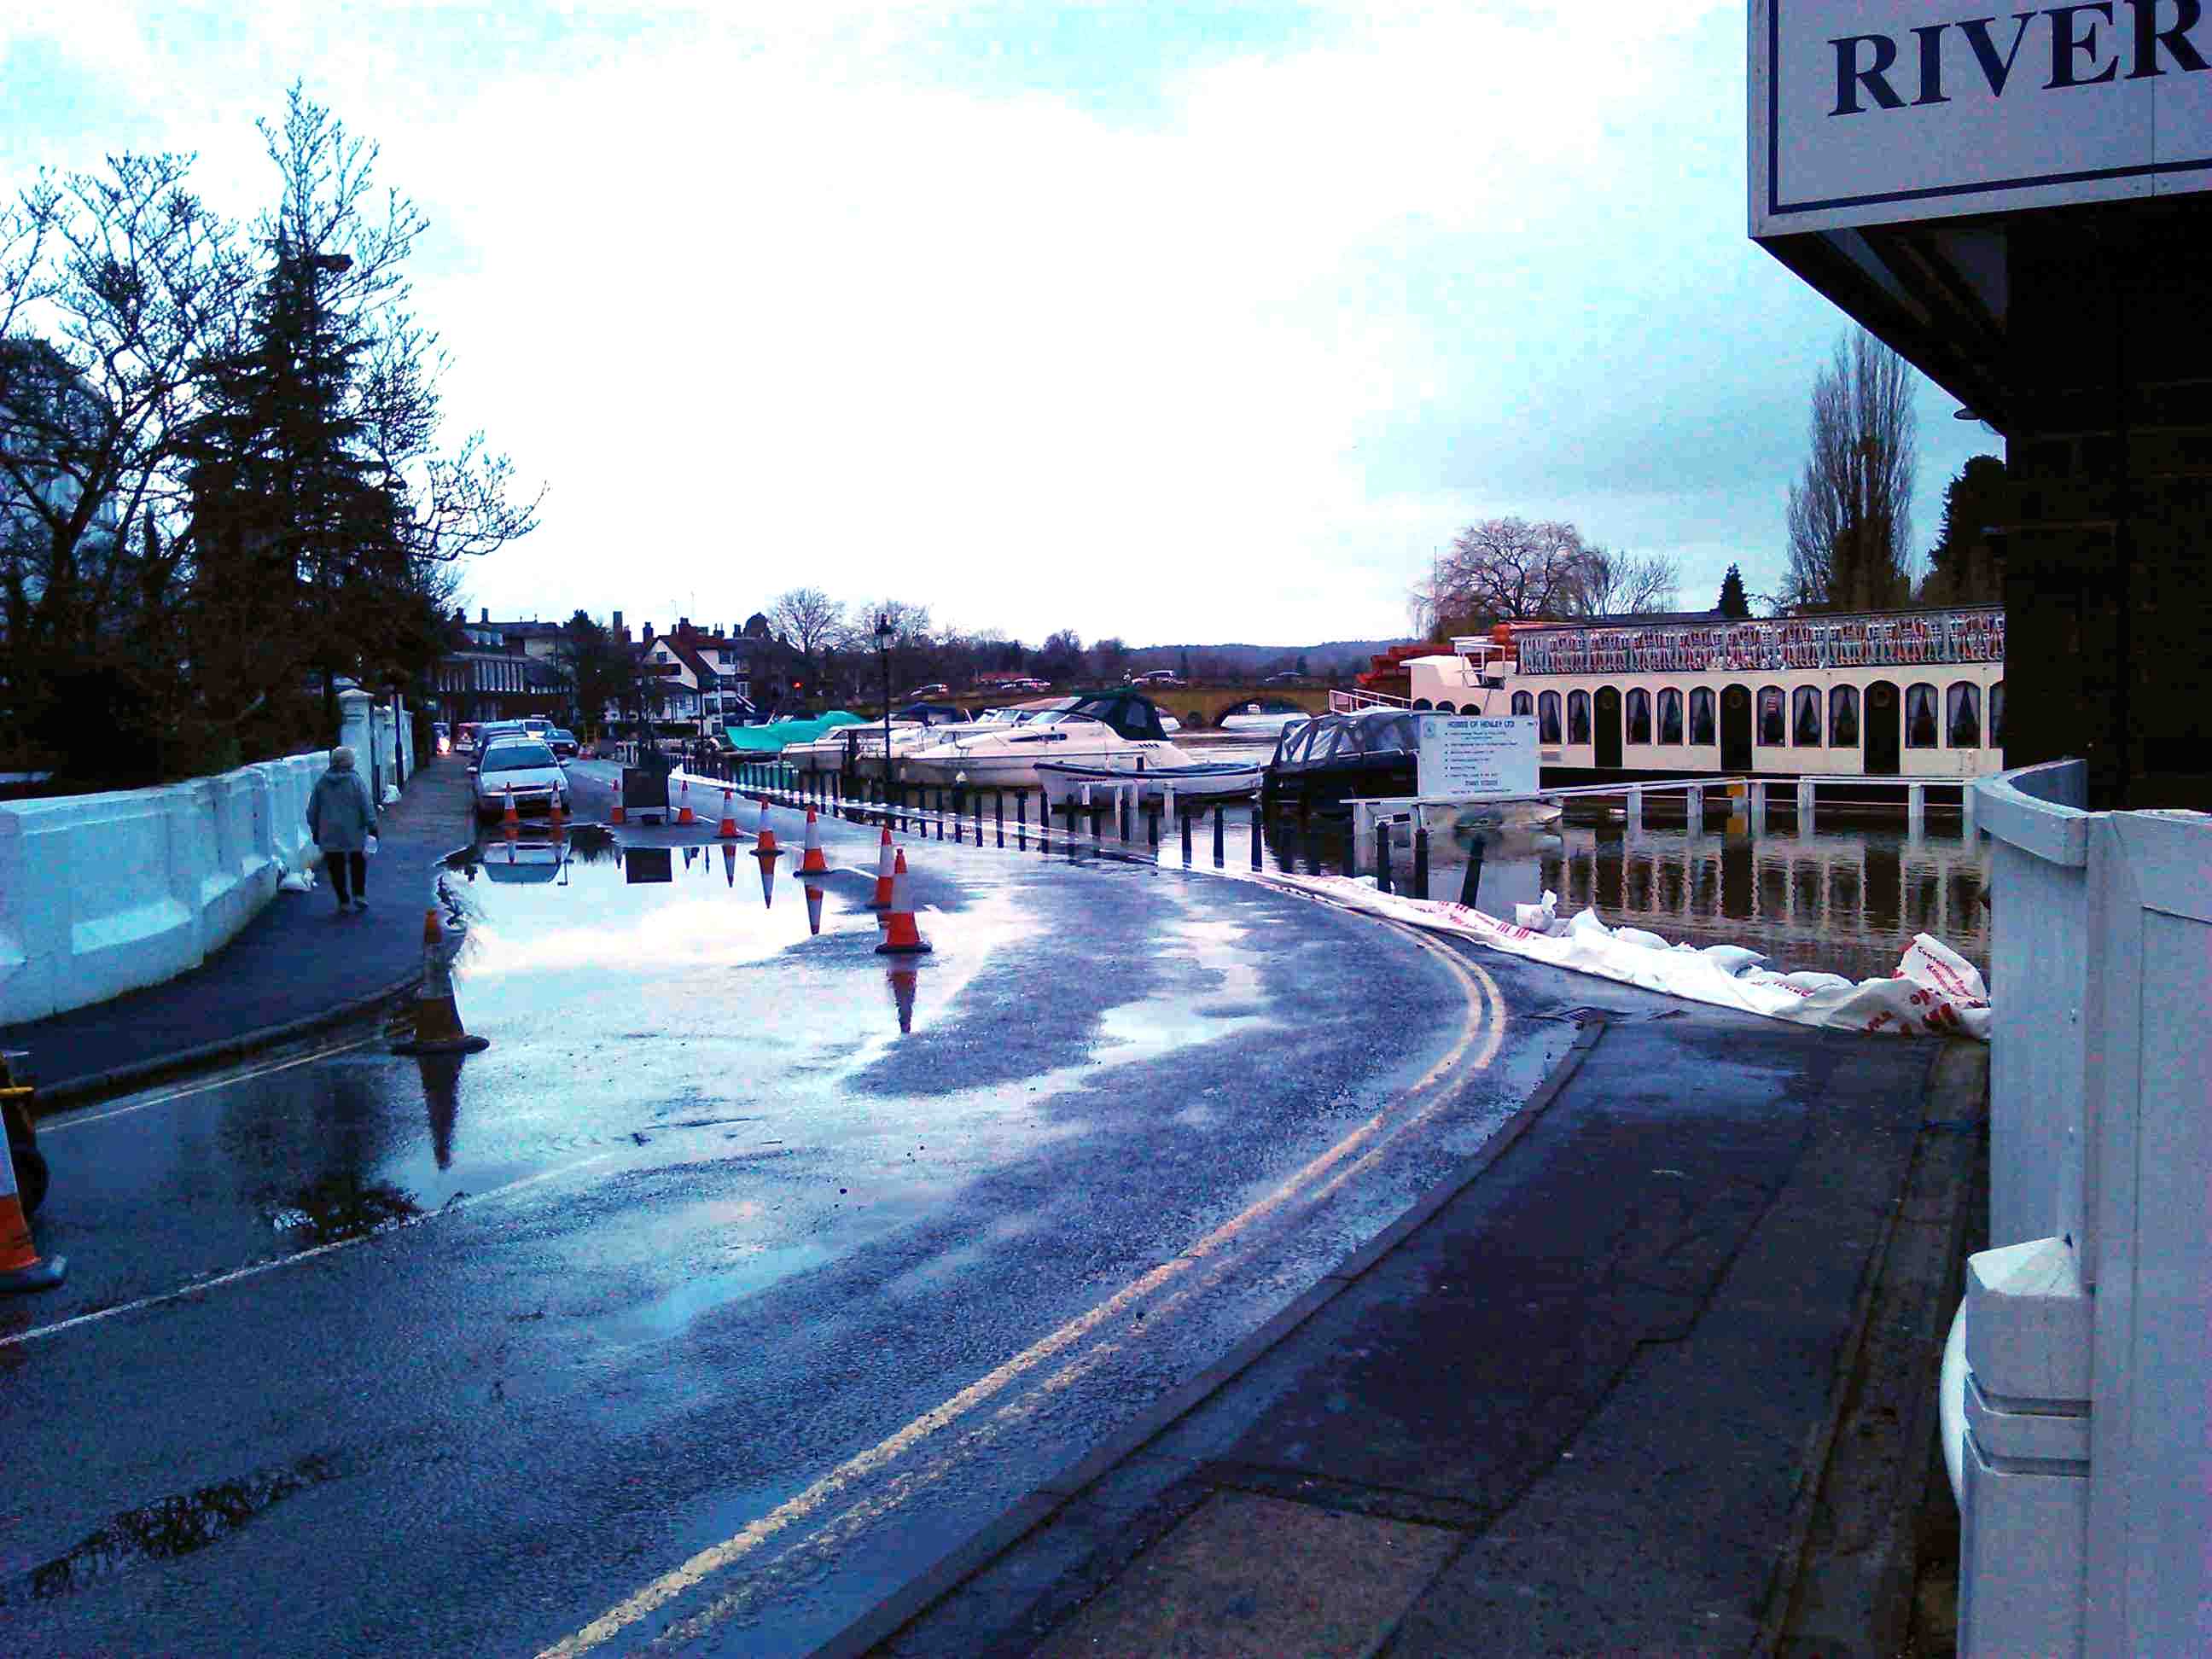
Can we row? If not, when? - Live reports - EA Flood warnings . AA Live Traffic map . Webcam at Hobbs. Pictures of Winter floods 2013-2014 |
 |

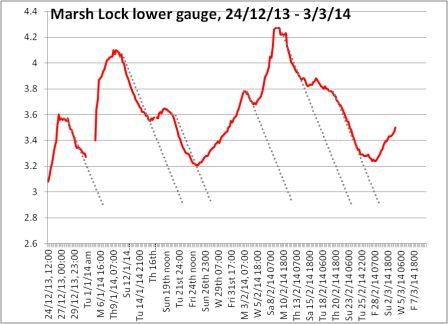
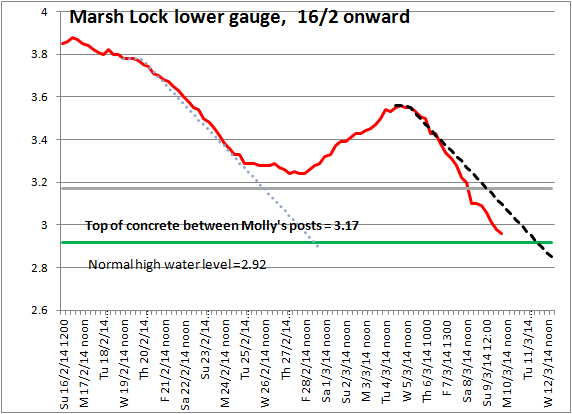
Thanks to our Bob for his Continuous hourly plots |
|
(1b) If Molly is not accessible - When will she be? DIY Instant Rowing Date Prediction Rain Forecasts for the Catchment area are here (Oxfordshire) and here (Berkshire).- (The rain amounts tend to be overstated). |
|
(2) What about River Flow Rate?- Can we row safely in fast water? The EA chart says "
" < Please tell me if you see grey bar here not text) 2b) The Flow rate at Maidenhead is not very relevant to us because; (i) we are not at Maidenhead; (ii) with suitable crew we can row at quite high flow rates. It would be more useful to know the speed of the water at Henley, but we dont. |
| Flood warning GovUk (Henley). Flood Warnings GovUk map |
Live traffic map The AA Henley area. |
"Watercam" |
. . Back to Top |
From our intrepid reporters |
|||
 Thameside.10/2/14, 07:43. (Thanks RM) Gauge reading 4.22m |
|
|
|
| Shiplake lock & island, Thameside 8/2/14. See the river cascading across the island. | |||
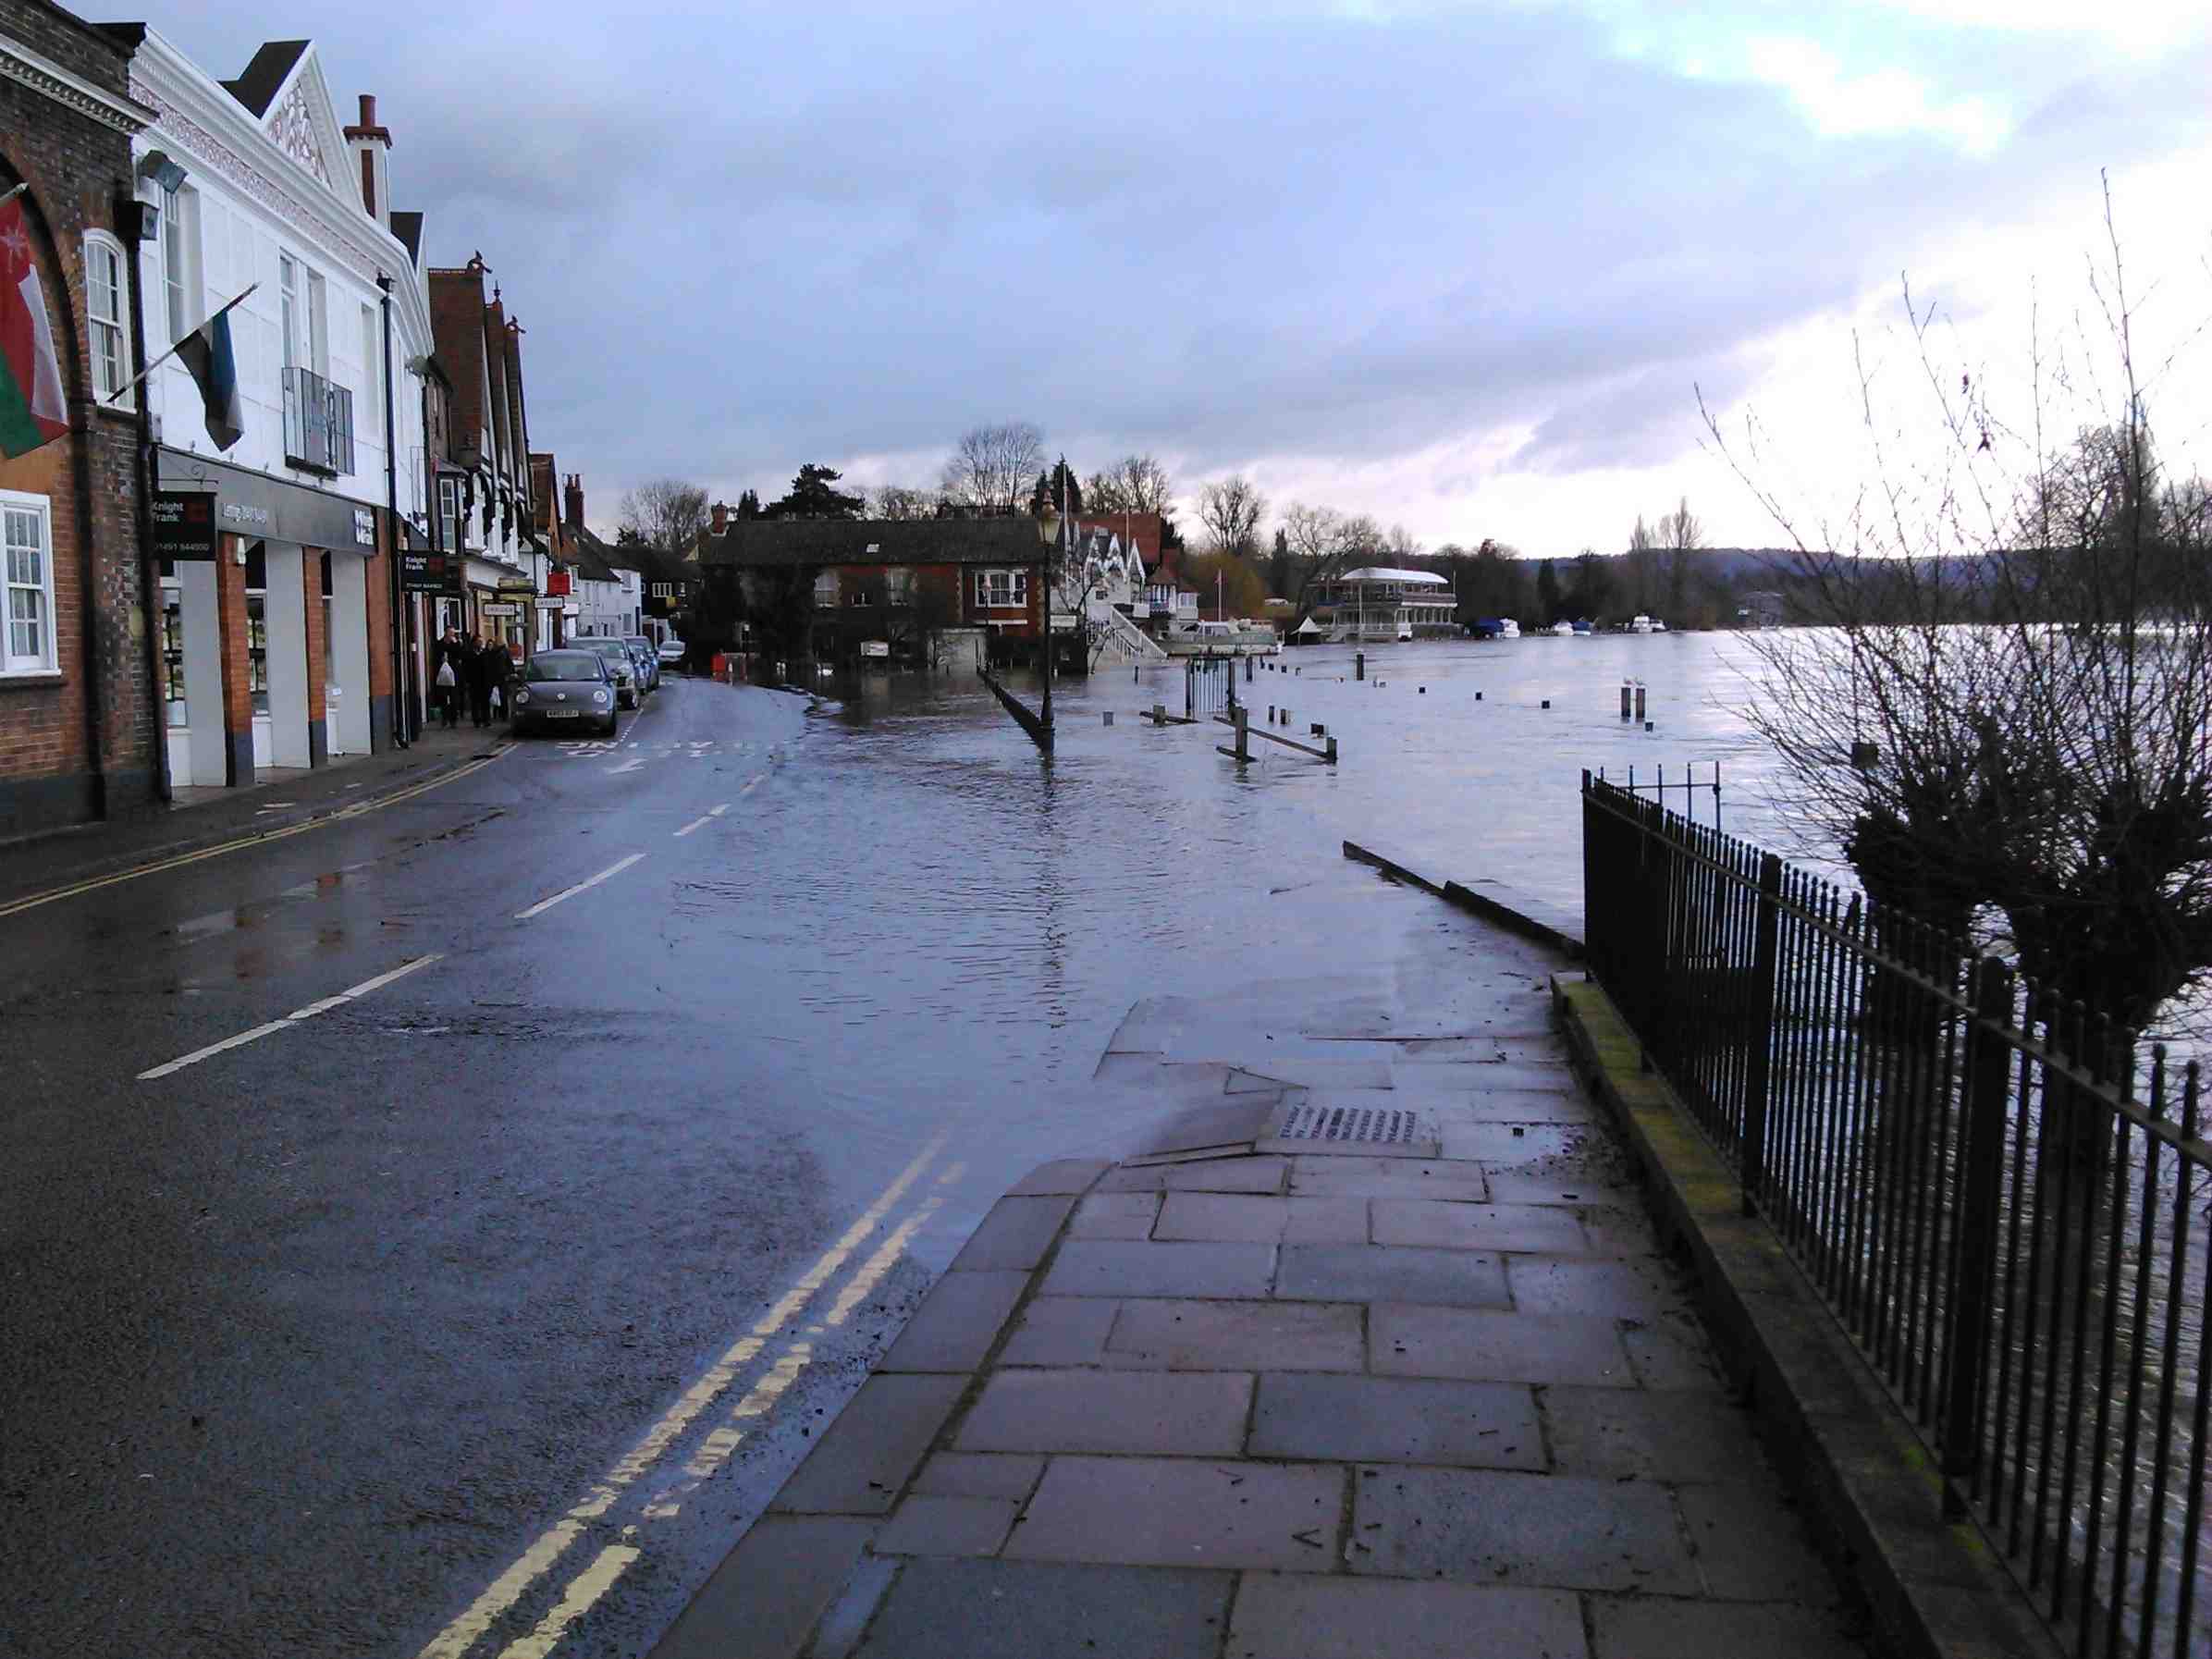
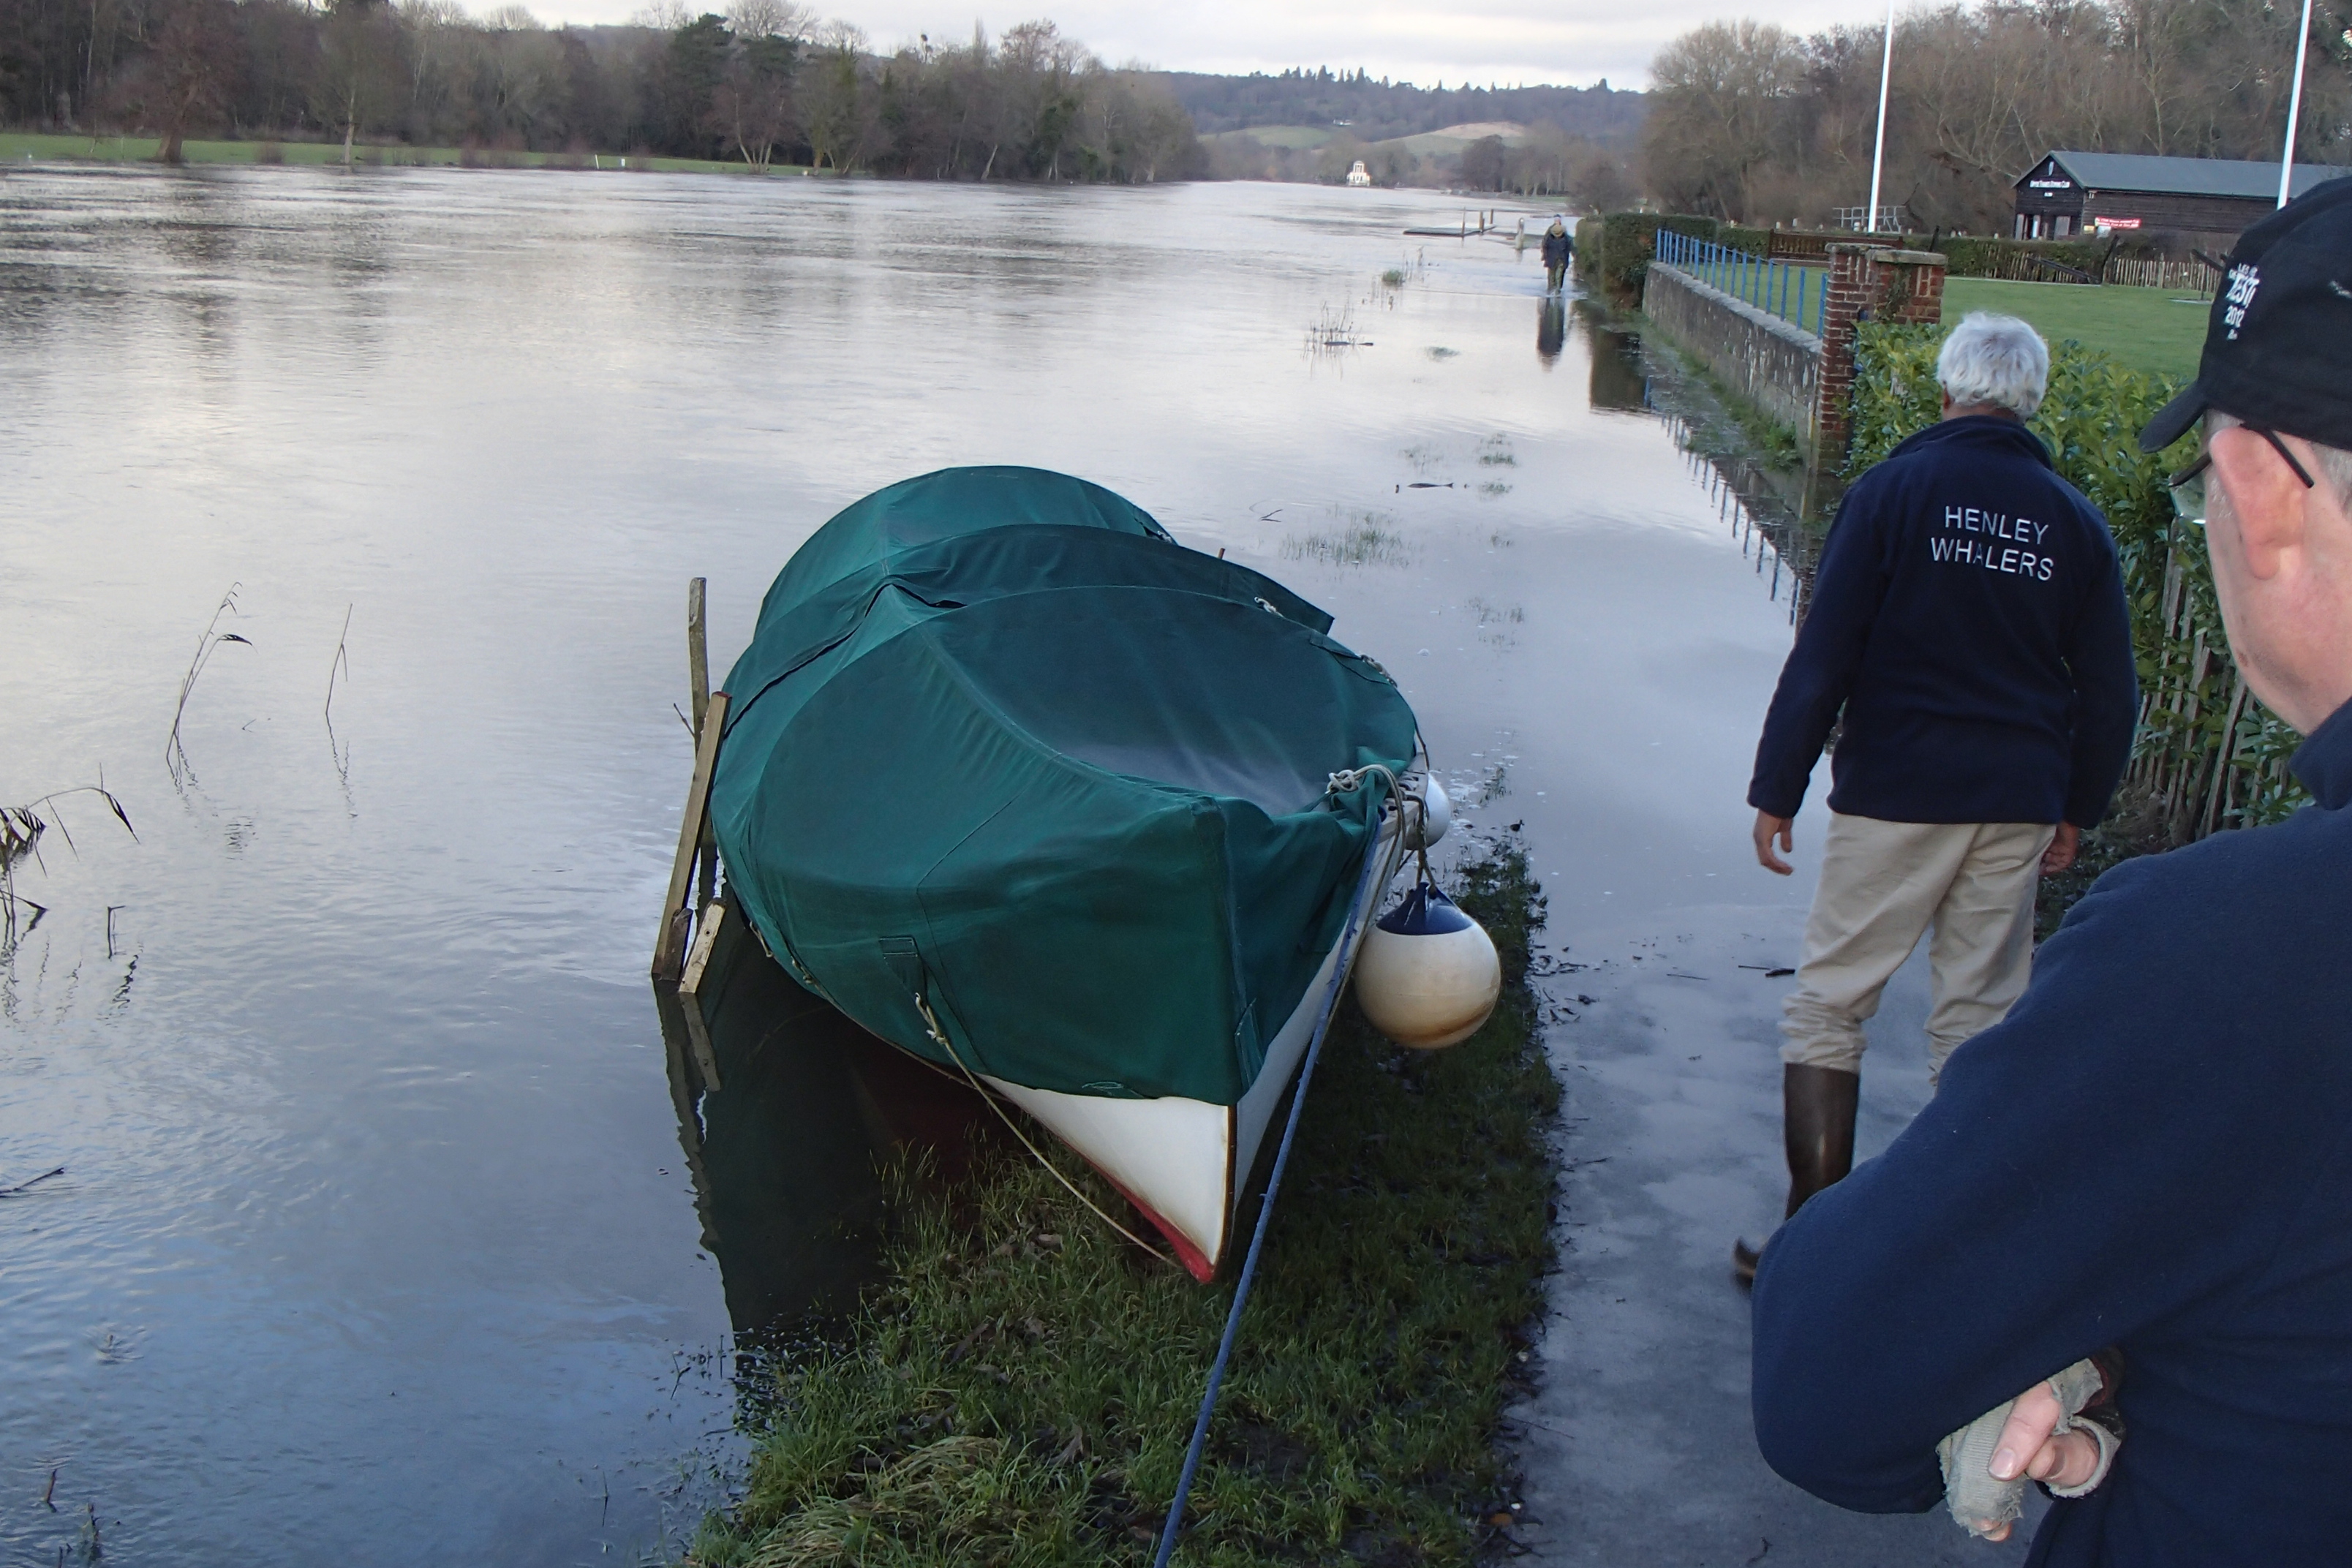
| Molly beached, Towpath 17/1/14. Gauge reading 3.58m |
 |
||
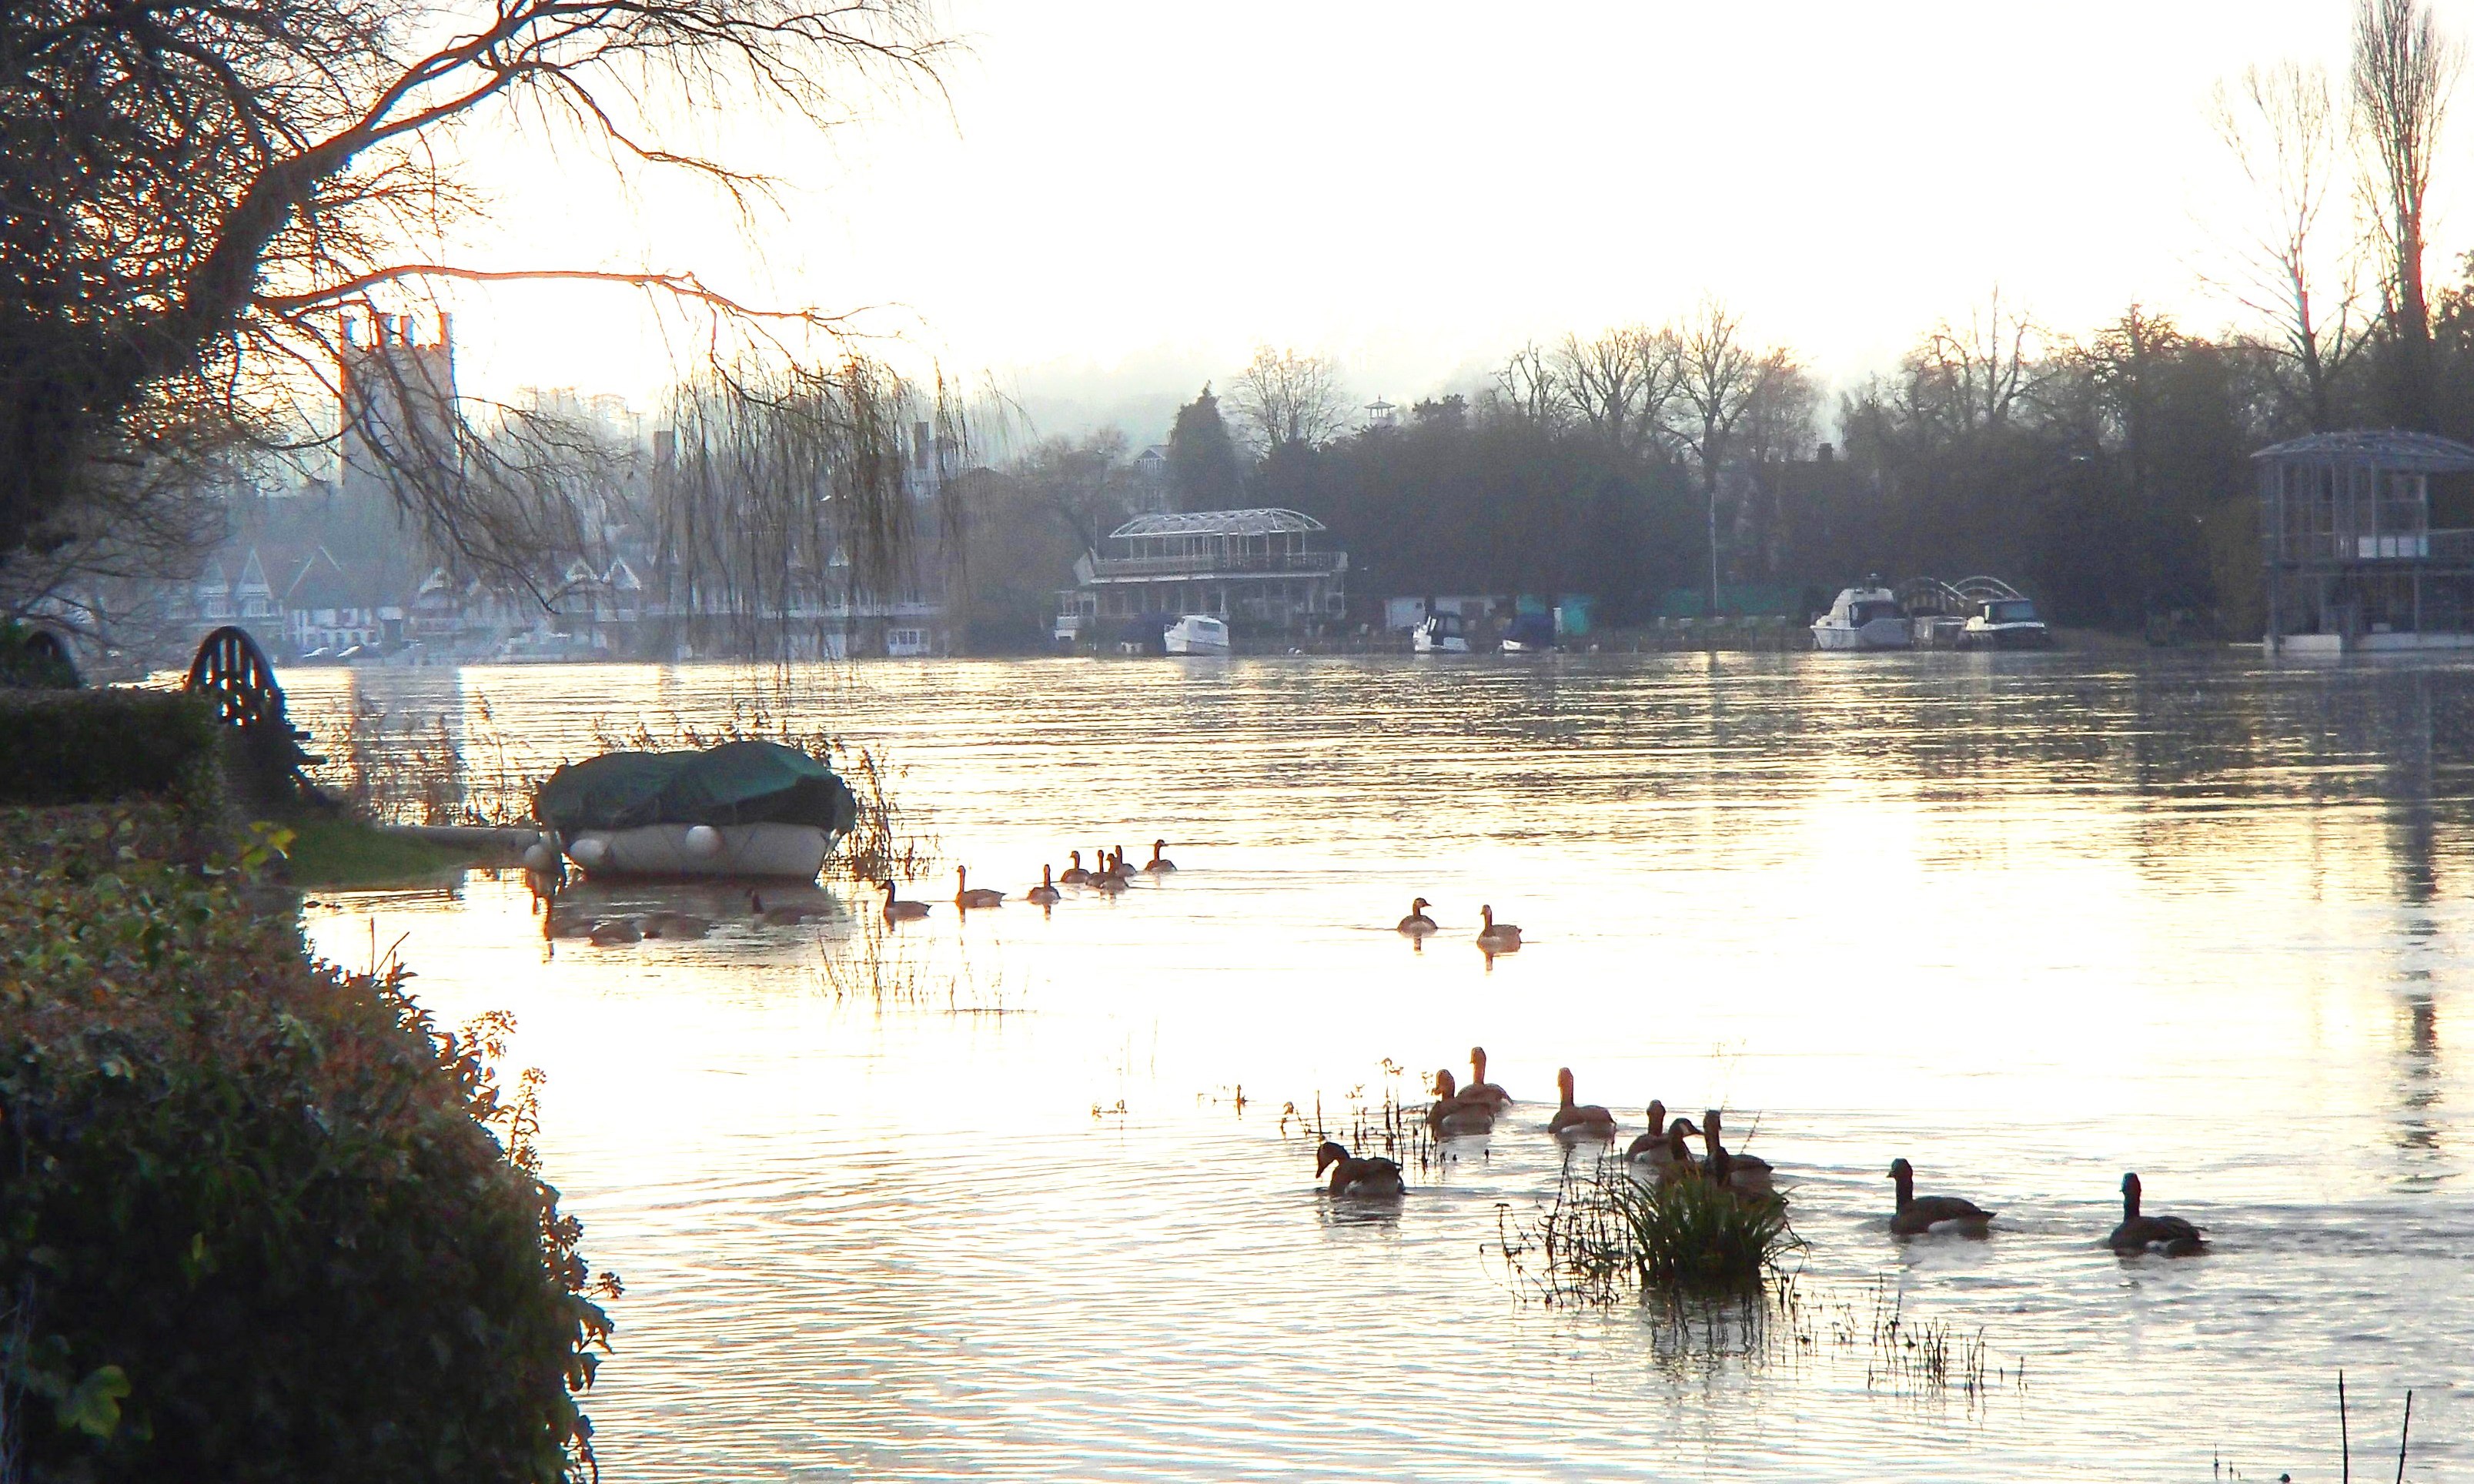
Boxing Day, December 26th 2013, 15:00. "Molly" accessible only to the intrepid (and waterfowl) Other Boxing Day pictures click here |
|
||
. . Back to Top |
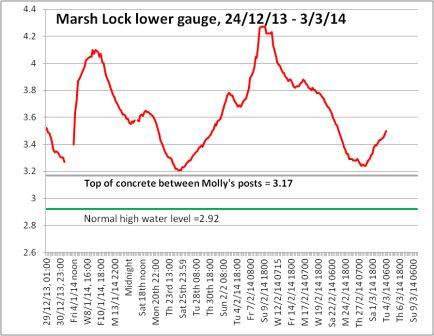
The minimum number of number of days to "normal level" = (Gauge reading - 2.92) / 0.1 |
The minimum number of number of days to "dry concrete" = (Gauge reading - 3.17) / 0.1 |
. . Back to Top |
Still reading? River levels Data - From St John's to Marsh -
You can determine where the "crest of the wave" is. |
Can we row? If not, when? - Live reports - EA Flood warnings . AA Live Traffic map . Webcam at Hobbs. |
|