Henley Whalers ![]()
![]()
![]() Flood Fo'cuss
Flood Fo'cuss

Henley Whalers | |
This page has been superceded - You may wich to amend your "Favourites/Bookmarks" Click HERE for the new page. |
 |
The material below will soon be deleted - It has been replaced by a better version. Click HERE for the new page..
(1a) Is Molly accessible? "Dry shoe" access, when the concrete between Molly's
two
mooring posts is "dry", is possible when the Marsh Lock Downstream gauge reads 3.17m (maybe 3.2m?) or less. (1b) What about River Flow Rate?- Can we row safely in fast water? Look for "Marsh to Hambleden Lock" in this chart. |
(2) If Molly is not accessible - When will she be? DIY Instant Rowing Date Prediction Rain Forecasts for the Catchment area are here (Oxfordshire) and here (Berkshire) .- (The rain amounts tend to be overstated). |
"Watercam" |
|||
Live flood map GovUk (Henley).Flood warning GovUk (Henley) Flood Warnings GovUk map Live traffic map & reports Oxfordshire BBC - has links to Berks, Bucks, etc. |
|||
. . Back to Top |
Hypothesis - If the level is too high to row, when might we resume? |
|
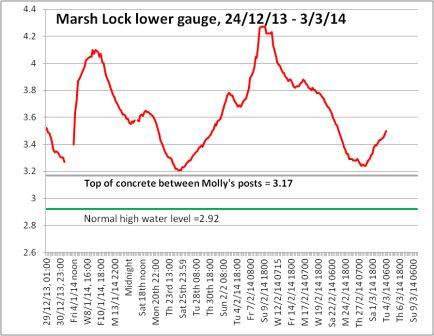
This Hypothesis Is based upon observations made during the winter floods of 2013 - 2014. Graph 1Shows the water level (Marsh lock lower gauge) from 24th December 2013. (The time scale is not quite linear, and there are gaps - One does need sleep! Normally 4 readings are recorded per day) |
 Version 3/3/14 |
Graph 2Is the same as graph 1, with dotted lines added to highlight the "No-Rain Descent-Rate". Continue to Graph 3. |
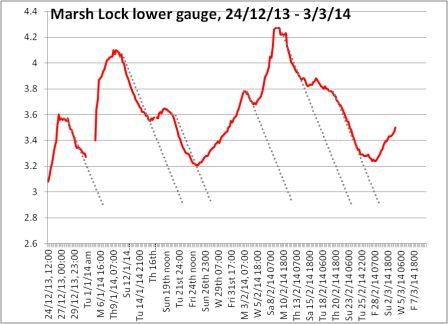 Version 3/3/14 |
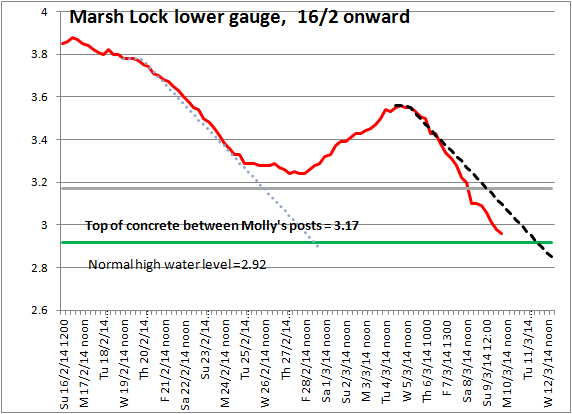
Graph 3 Shows Marsh Lock lower gauge reading from 16/2/14.
|
|
The minimum number of number of days to "normal level" = (Gauge reading - 2.92) / 0.1 |
The minimum number of number of days to "dry concrete" = (Gauge reading - 3.17) / 0.1 |
. . Back to Top |
Still reading? River levels Data - From St John's to Marsh -
You can determine where the "crest of the wave" is. |
. . Back to Top |
Winter 2013 - 2014 |
 |
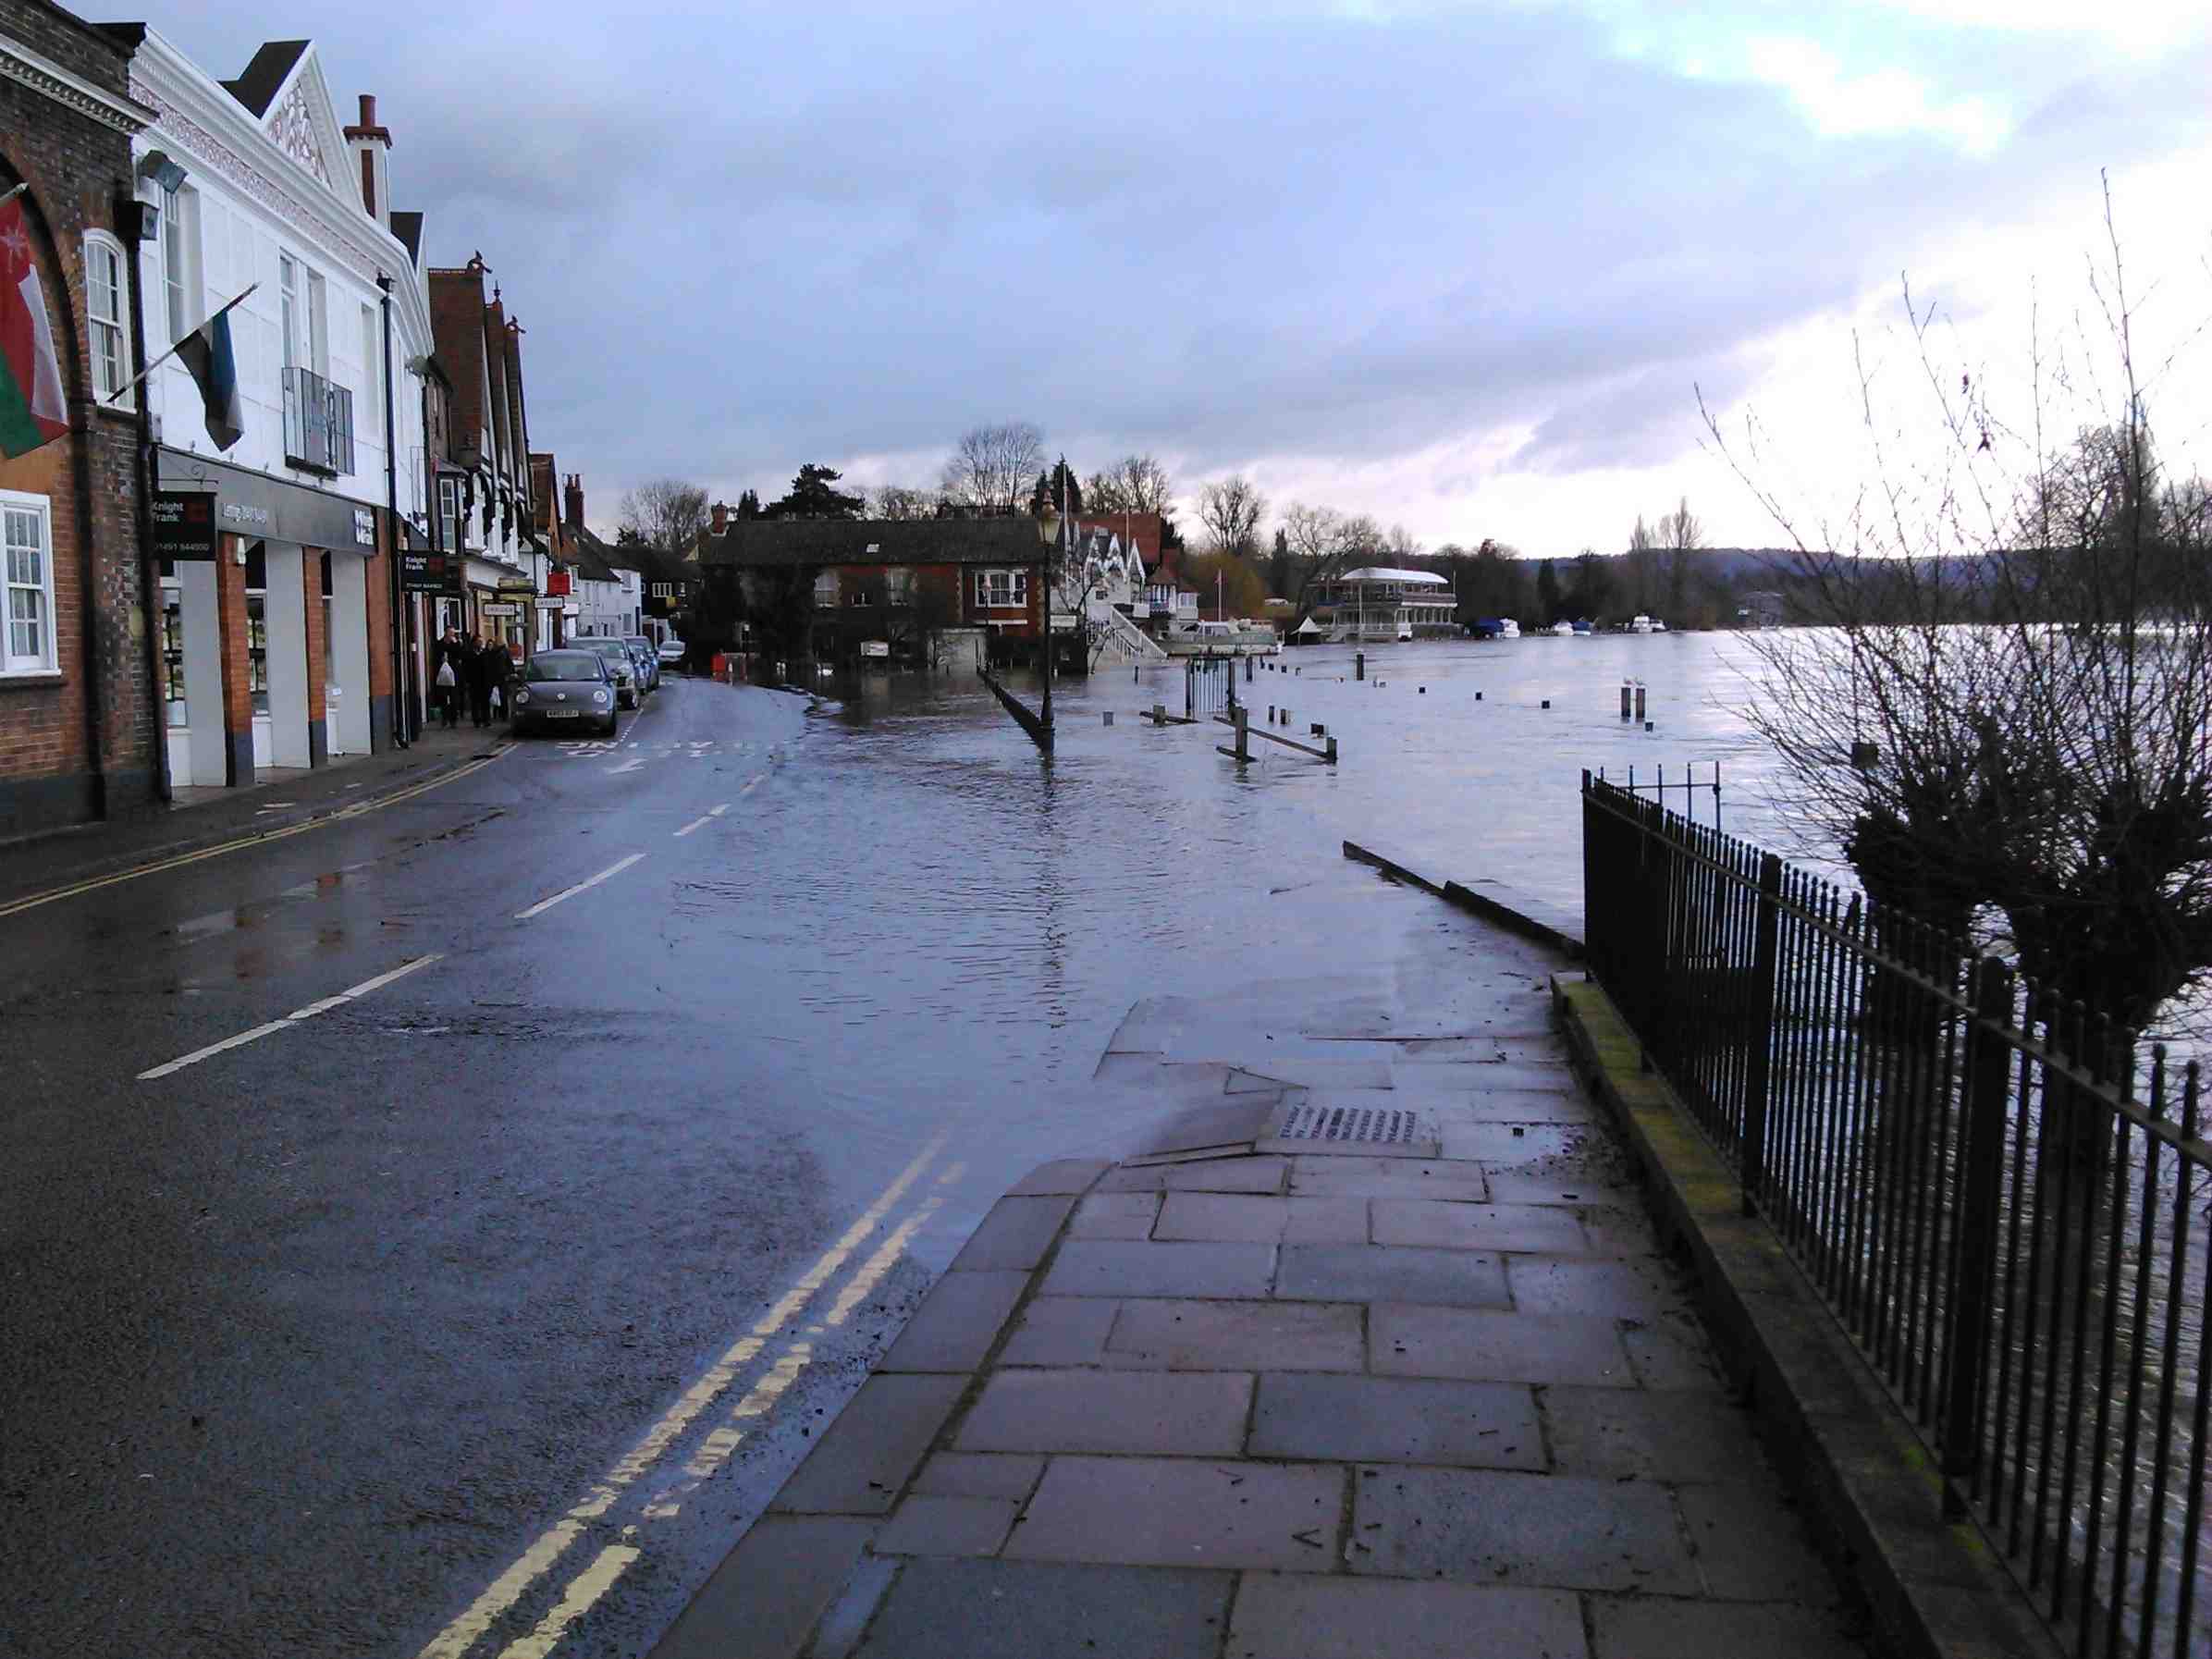
Whalers' Boxing Day Mince-pie row cancelled due to high river level. So we waded to the bandstand on Mill Meadows. We did not row from 11/12/13 till 12/3/14. 15 events were cancelled during 3 months of flood. |
From our intrepid reporters |
|||
 Thameside.10/2/14, 07:43. (Thanks RM) Gauge reading 4.22m |
|
|
|
| Shiplake lock & island, Thameside 8/2/14. See the river cascading across the island. | |||
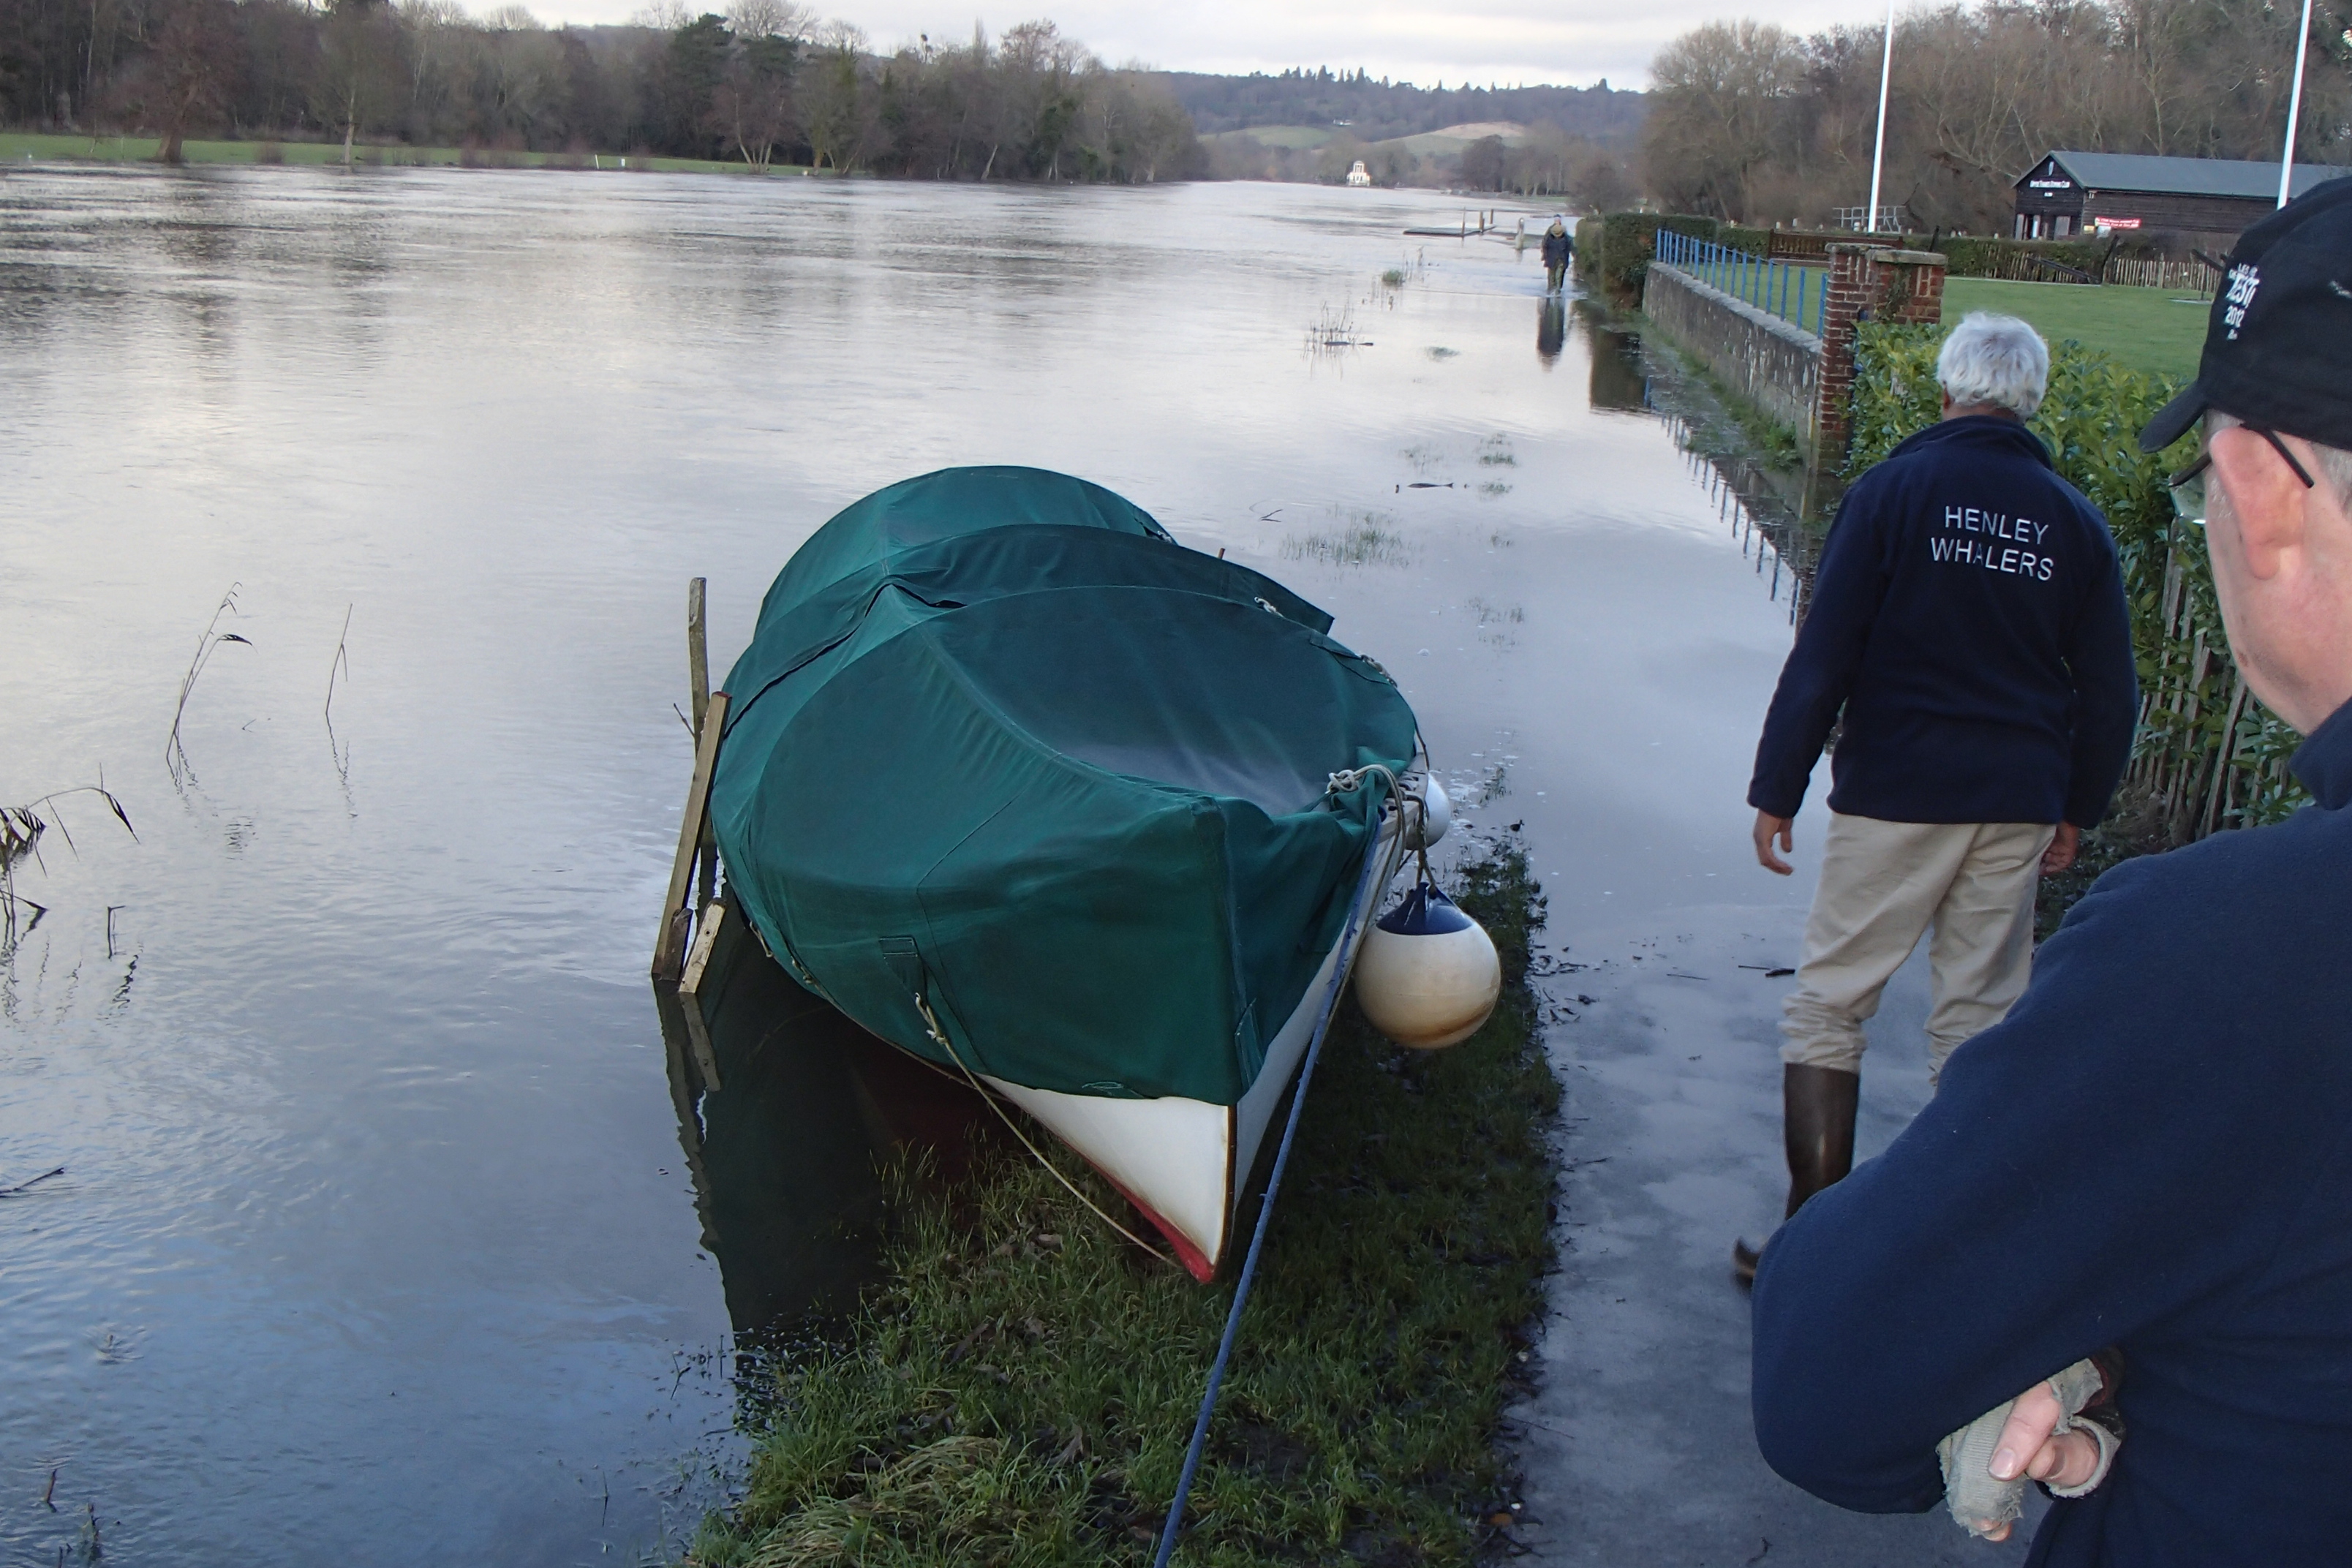
| Molly beached, Towpath 17/1/14. Gauge reading 3.58m |
 |
||
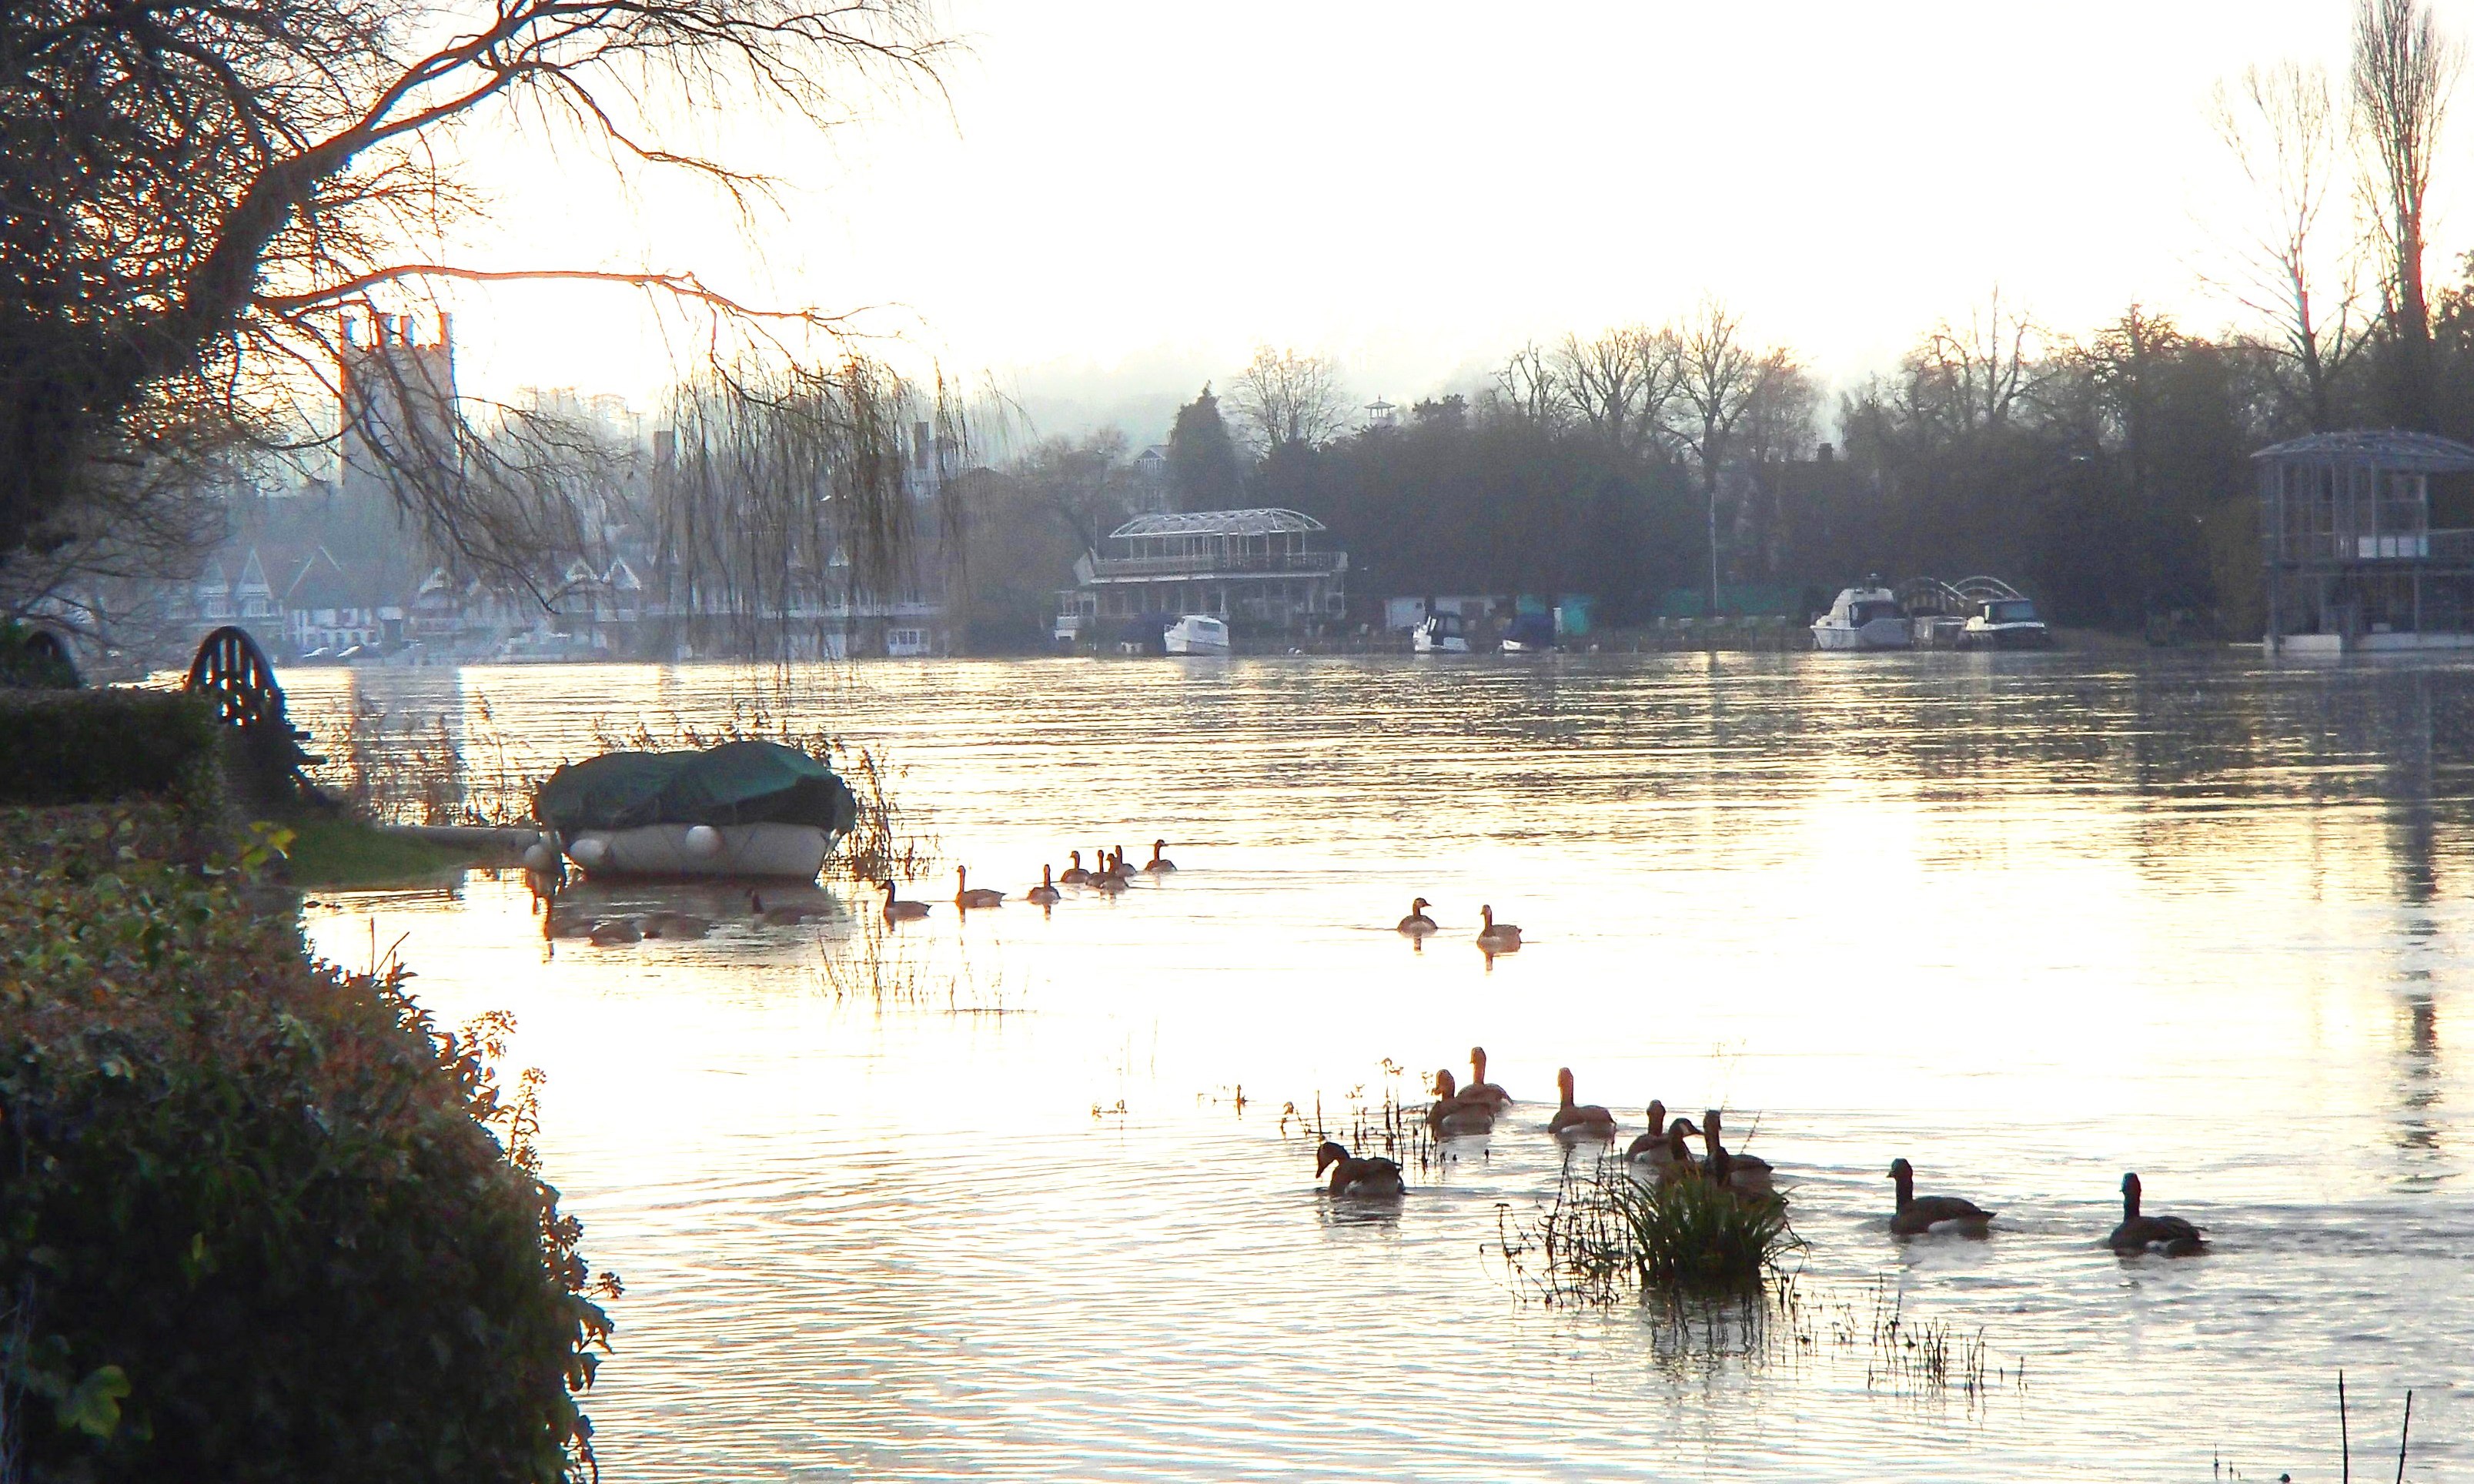
Boxing Day, December 26th 2013, 15:00. "Molly" accessible only to the intrepid (and waterfowl) Other Boxing Day pictures click here |
|
||
If you'd like to suggest alternative material or presentation, contact webmaster . |
Can we row? If not, when? - Instant prediction . Winter 13-14 - Pictures . |